Measure what matters
SLA compliance, agent performance, volume trends, and real-time KPIs. Every metric your support operations need to improve -- and prove it.
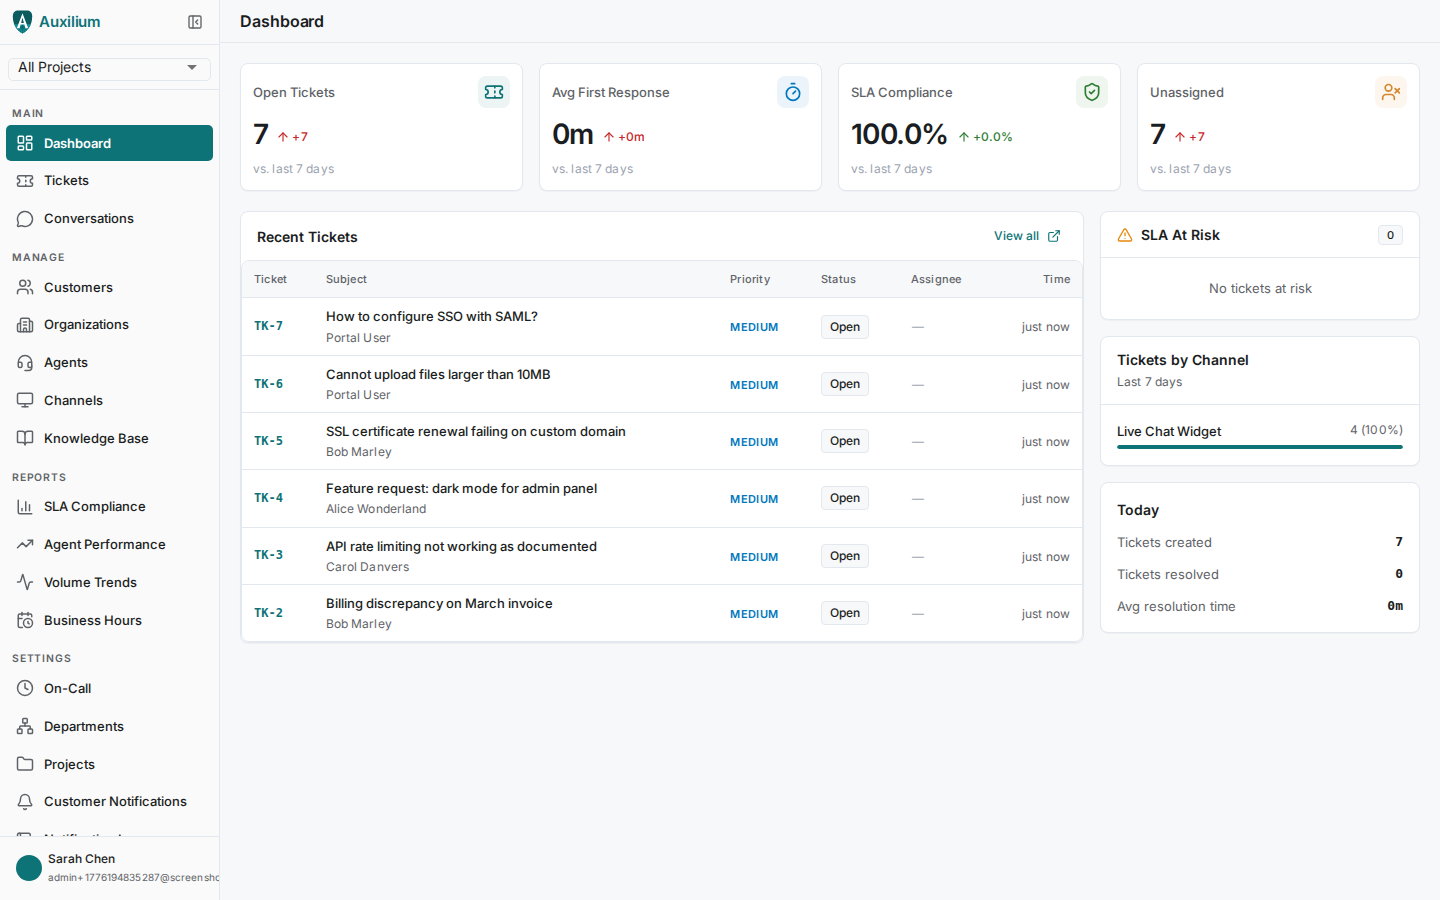
Your support operations at a glance
A single dashboard shows open tickets, average first-response time, SLA compliance, today's volume, resolution trends, channel breakdown, and at-risk tickets. Compare against the previous period to spot regressions.
- Open tickets, unassigned count, SLA compliance percentage
- Average first-response and resolution times
- Today's created vs. resolved ticket comparison
- At-risk tickets with time-to-breach countdown
4 reporting pillars
Deep analytics for SLA compliance, agent performance, volume trends, and real-time operations.
SLA compliance
Breach rates over time (daily, weekly, monthly). Distribution of first-response and resolution times at p50, p75, p90, p95, p99. Filter by project and priority.
Agent performance
Per-agent metrics: tickets assigned, tickets resolved, average first-response time, average resolution time. Customizable date ranges.
Volume trends
Ticket volume over time with daily, weekly, or monthly granularity. Breakdown by channel type, priority, and project.
Real-time dashboard
Open and unassigned ticket counts, average response times, SLA compliance percentage, today's created/resolved counts, and at-risk tickets.
Act before the breach
The dashboard doesn't just report on the past. It highlights tickets approaching SLA breach right now, showing you which tickets need attention in the next 30 minutes and 2 hours.
- Critical alert: tickets breaching within 30 minutes
- Warning alert: tickets breaching within 2 hours
- Trend comparison vs. previous period
- Filterable by project and priority level
Dashboard KPIs
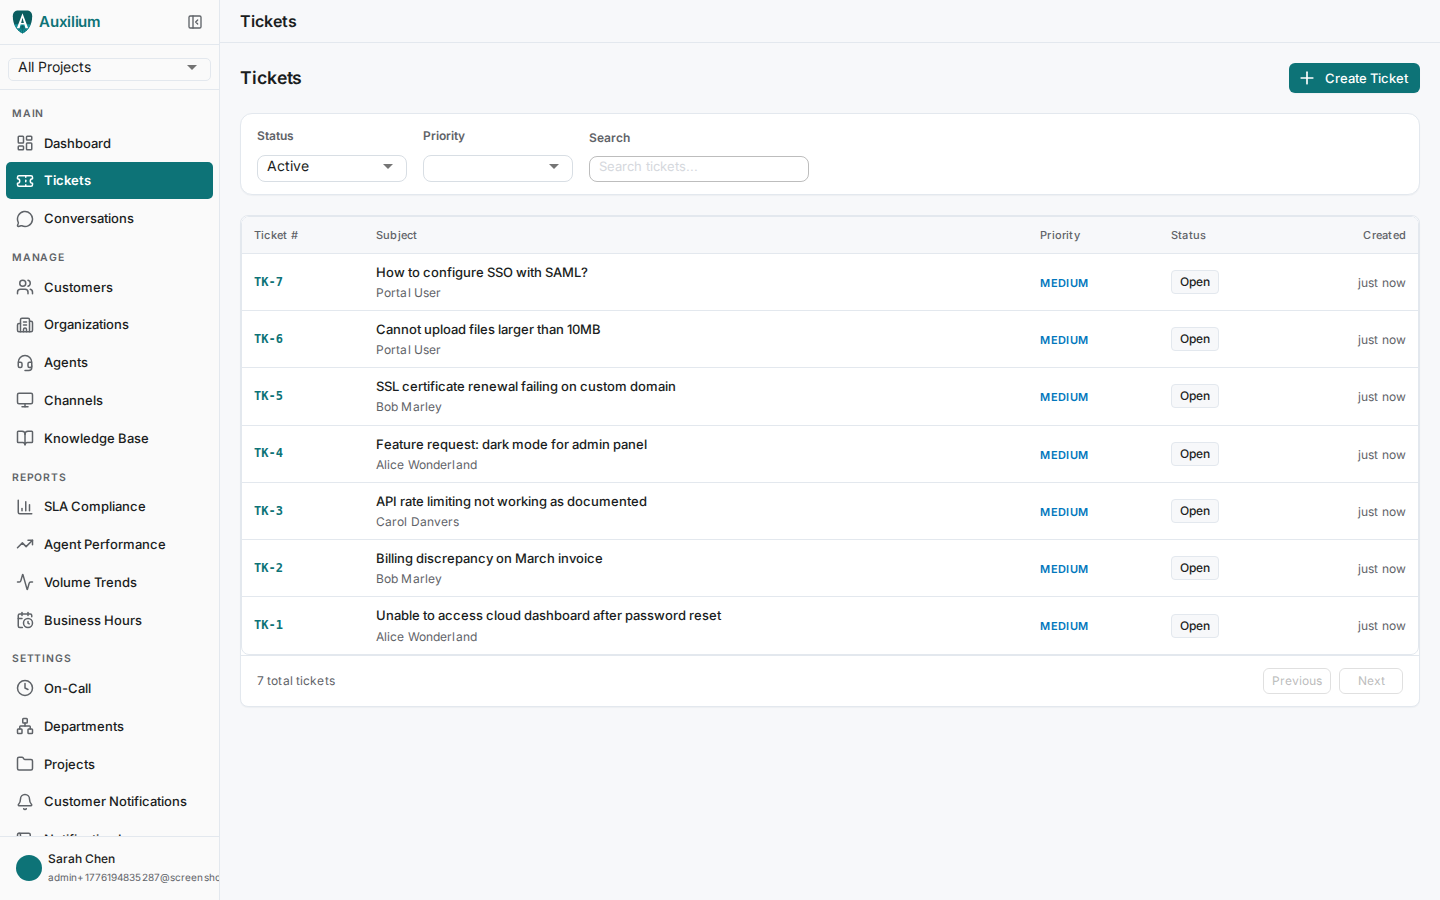
Open & unassigned tickets
See how many tickets are open and how many need assignment right now. Track trends vs. the previous period.
At-risk tickets
Critical (under 30 minutes to breach) and warning (under 2 hours to breach) tickets are highlighted for immediate attention.
Channel breakdown
See ticket distribution across channels. Identify which channels drive the most volume and where to invest.